I have compiled the DWM1004c Source code for TDoA. Now I am trying to load it into board but can not get the JLink to show under debug. I am using the USB connection. I am using AC6 Tools System Workbench for STM32 version 2.9
Hi Mike,
I’ll check my IDE and come back later today - long time since I was doing DWM1004C debug, need to find a hardware piece and recall the steps I made to setup the toolchain.
Launch J-Flash Lite 6.12, choose STM32L041G6 as a device, SWD interface, Speed 1000
Erase chip, load the precompiled binary from the package folder Software\ARM_binary\ DWM1004C-TDoA-Tag.hex and program it to verify that the drivers and J-Link software works correctly
launch SW and import the project as General/Existing Projects into Workspace, make it – there should be no errors
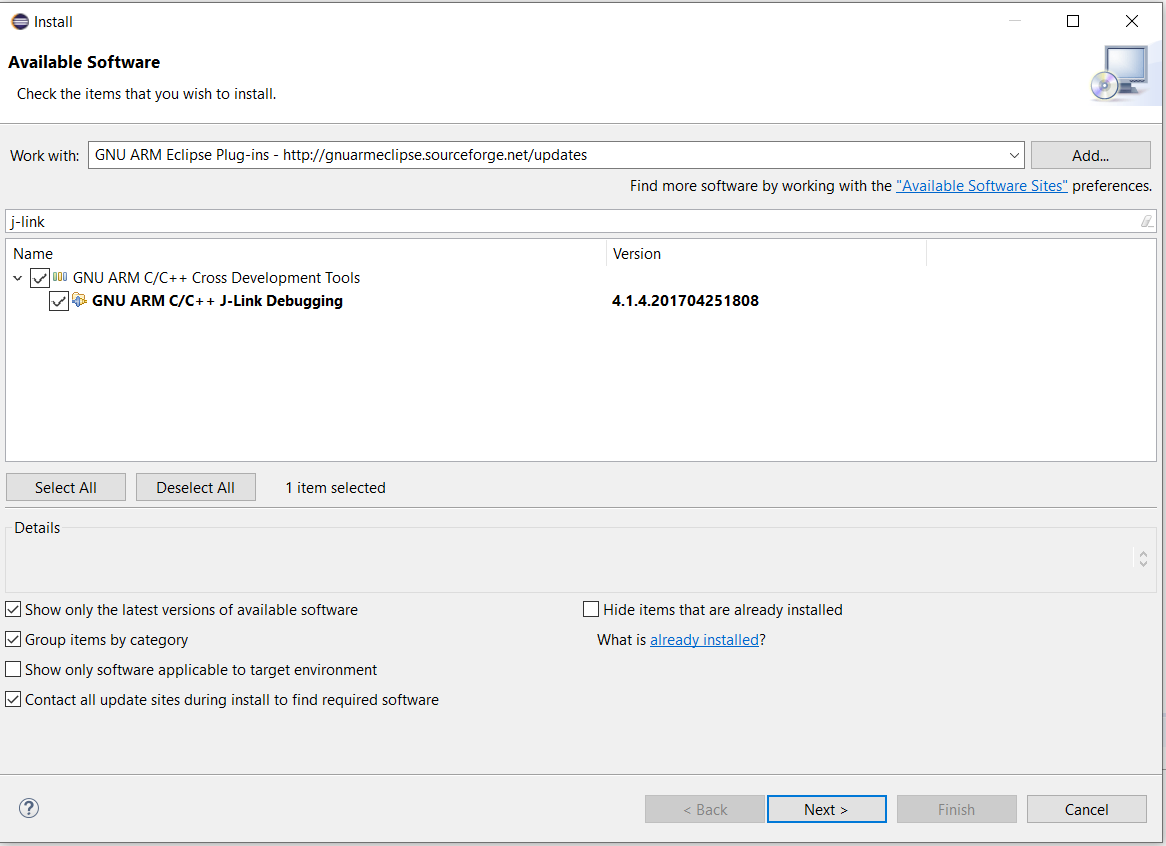
Install GNU ARM Eclipse Plug-ins: Help/Install New Software…, add software site http://gnuarmeclipse.sourceforge.net/updates . Select it, type “j-link” in the filter text, install plugin GNU ARM C/C++ J-Link Debugging
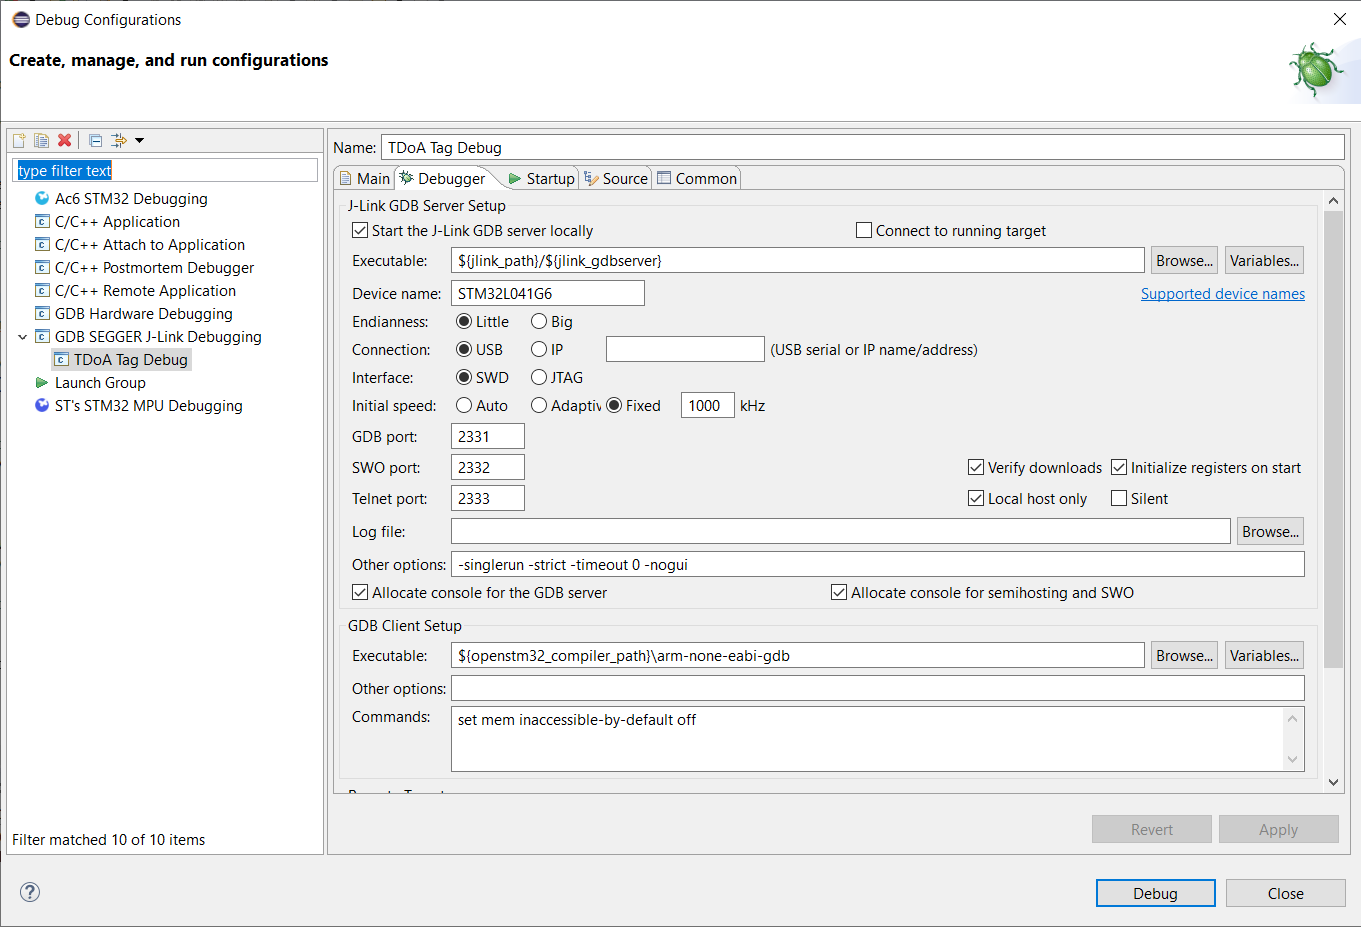
In Run/Debug Configurations double click GDB SEGGER J-Link Debugging – this creates a new configuration. Name it, choose project and application (Search Project…). In the Debugger tab set device name to STM32L041G6, change GDB Executable to ${openstm32_compiler_path}\arm-none-eabi-gdb