Incorrect reading CIR value from register

Hi everyone,

I am using a board based on dwm1000 module. I want to use the dwt_readaccdata() function reads the CIR value from the accumulator CIR memory. I imitated the example you provided, just simply read the value near FirstPathIndex.

Now I have a few questions.

  1. In the example,.
    uint16 fp_int = rx_diag.firstPath / 64;
    dwt_readaccdata(accum_data, ACCUM_DATA_LEN, (fp_int - 2) * 4);
    why rx_diag.firstPath is divided by 64, not any other number? I think it is 32, because according to dw1000_user_manual 7.2.38 Register file: 0x25 – Accumulator CIR memory, every 32bits is a sample.

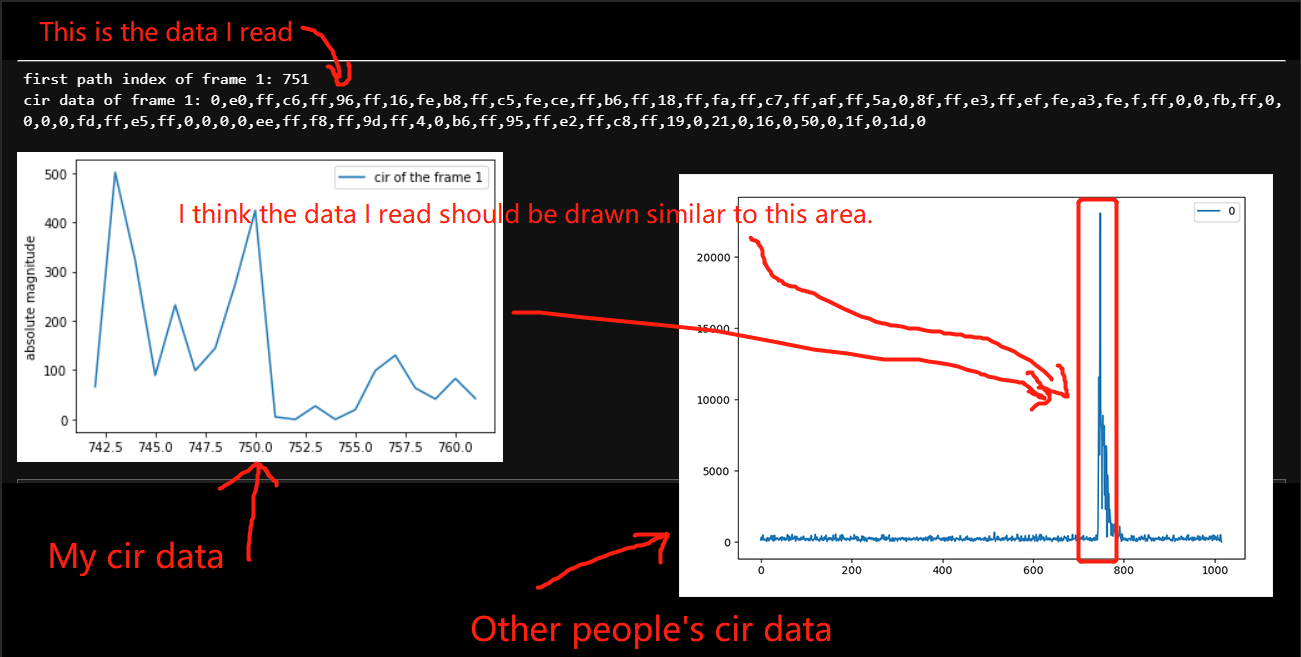
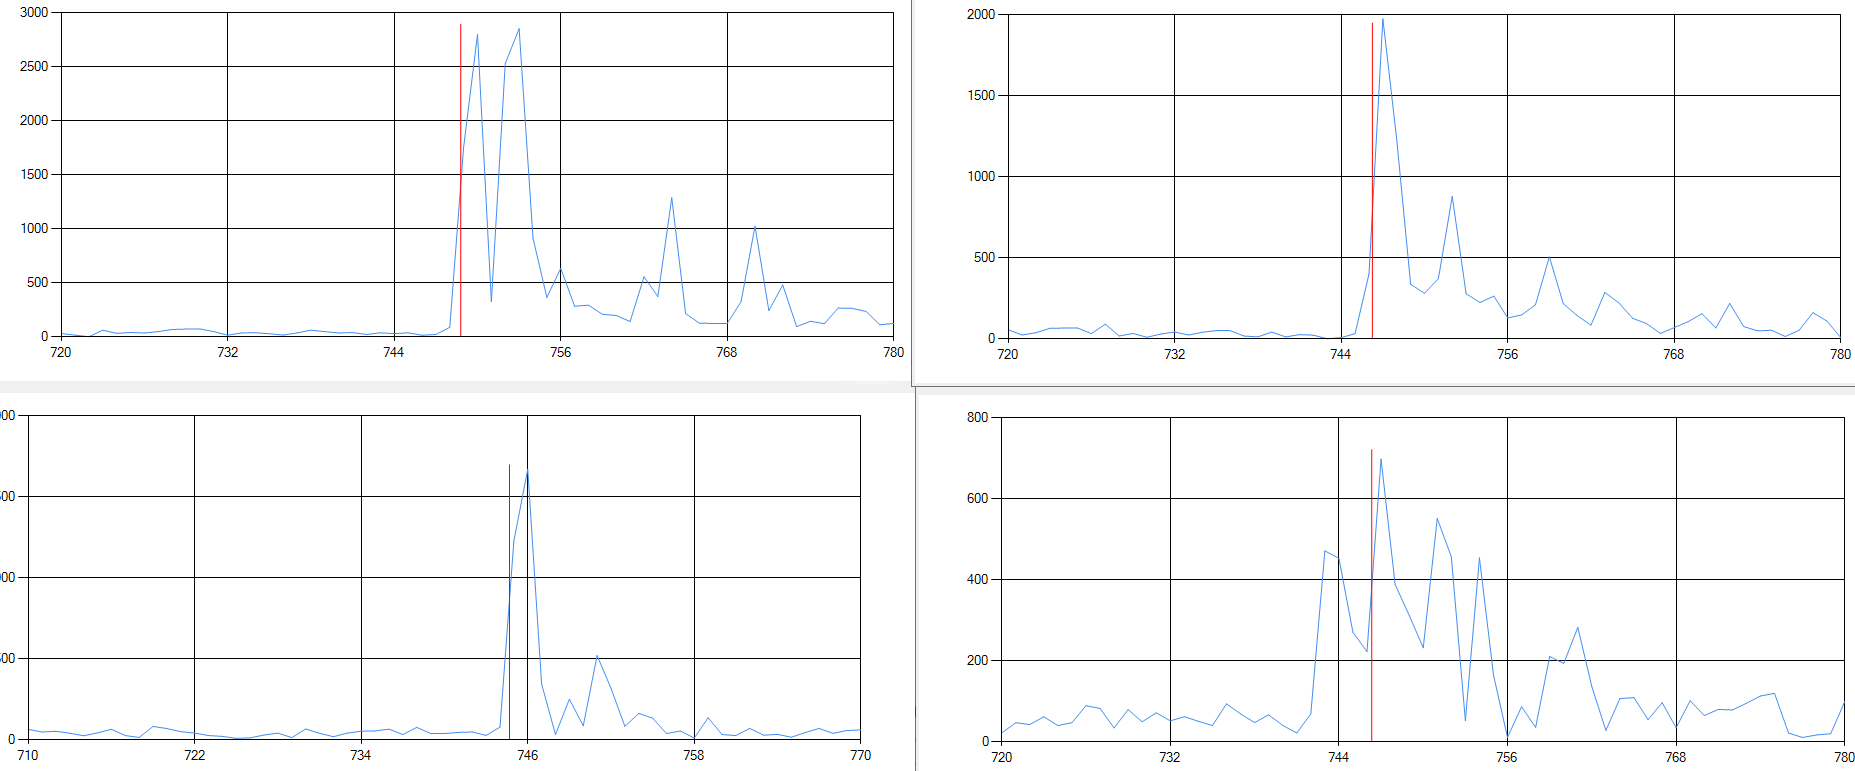
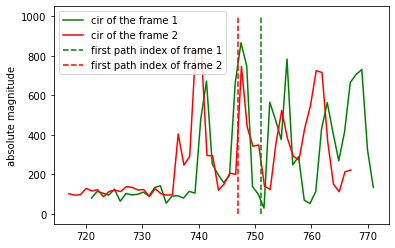
2.I imitated the code in example to write the program, but got a strange CIR value. I will write my code and the CIR value I read.

int FirstPathIndex = 0;
uint8 CIR_data[25];
dwt_readdignostics(diagnostics);
uint16 fp_int = FirstPathIndex / 64;
dwt_readaccdata(CIR_data, 25, (fp_int - 2) * 4);

m = sprintf((char*)&usbVCOMout_CIR[0], "CIR:%d, %d, %d, %d, %d, %d, %d, %d, %d, %d, ", 
					CIR_data[0],CIR_data[1],CIR_data[2],CIR_data[3],CIR_data[4],
					CIR_data[5],CIR_data[6],CIR_data[7],CIR_data[8],CIR_data[9]);
m += sprintf((char*)&usbVCOMout_CIR[m], "%d, %d, %d, %d, %d, %d, %d, %d, %d, %d, ", 
					CIR_data[10],CIR_data[11],CIR_data[12],CIR_data[13],CIR_data[14],
					CIR_data[15],CIR_data[16],CIR_data[17],CIR_data[18],CIR_data[19]);
m += sprintf((char*)&usbVCOMout_CIR[m], "%d, %d, %d, %d, %d\r\n", 
					CIR_data[20],CIR_data[21],CIR_data[22],CIR_data[23],CIR_data[24]);
App_Module_Uart_USB_Send_1((uint8_t *)usbVCOMout_CIR, m);

The result read is:
CIR:0, 114, 1, 47, 254, 59, 1, 251, 253, 193, 0, 248, 254, 39, 0, 22, 0, 152, 0, 30, 255, 174, 0, 244, 253

After removing the first value and calculating the real part, imaginary part and module, it is obvious that it is wrong. For example, the real part will be 370 and the imaginary part is 65071(according to 114, 1, 47, 254)

Who can tell me where I’m wrong.

They are signed 16 bit values not unsigned. So 0x2F 0xFE is not 65071, it’s -465

What a stupid mistake I made.

Thank you very much

Hi,
Do you know why there are many zeros in the data I read? Is that normal?

zero in terms of absolute magnitude or do you mean individual bytes being zero?

For each sample you get an I and Q value. Normally you’ll want to combine these to give a total magnitude (sqrt (II + QQ)).
For the initial period (before sample ~740) the values you get will generally only be a few hundred (assuming a fairly quiet environment). This means that the initial values when expressed as a two byte integers are going to contain 0 in the high byte a lot of the time.

So I’d expect lots of bytes with a value of 0. Almost half of the bytes in the first 3/4 of the data will be either zero or FF since their magnitude will be small.

However once you look at the full 16 bit values (either I, Q or combined magnitude) I wouldn’t expect to see many zeros if any.

yes, you are right. After I calculate the absolute magnitude, they are non-zero.

However, after I calculate the absolute magnitude, the CIR value is still a small value near the first path index.

In my STM MCU, I executed the code including:

dwt_readdignostics(diagnostics);
FirstPathIndex = diagnostics->firstPath;
uint16 fp_int = FirstPathIndex / 64;
dwt_readaccdata(CIR_data, 81, (fp_int - 10) * 4);

I think the function of these lines of code is to read 10 values below the first path index and 10 values above. Yes, the first path index it reads is correct. But when I plot the CIR data I read, it’s like this(see the attachment).

Unfortunately, my USB port doesn’t allow me to get longer CIR data (but I’ll try).

Help me solve the problem. Thanks

My guess is that you have some sort of time alignment error going on somewhere.
When reading the CIR data the first few values returned are junk. When reading from the middle of the buffer you have to be very careful reading to keep things aligned exactly as you’d expect. Unless you’re really short on memory or time read the whole buffer even if you don’t output it. If for some reason you can’t queue that much data up as a single data output you can always output it in blocks with a short delay between each one.

What the CIR data will look like depends on your environment.
Your overall signal levels look a little low but that could be caused by all sorts of different things. The general shape is about what I’d expect from an office type environment, a few reflections fairly close to the peak but nothing too bad.

For some further examples I’ve attached 3 plots taken pretty much at random from a data set I had sitting around. The first two are a the same data with different levels of zoom and represent a good short range signal. You can see a low noise level, a clear leading edge and then a couple of reflections, this is similar to the chart of what you expect but you’ll notice that when I zoom in to the edge it looks a lot more like your data…


This 3rd is a far more interesting situation, the range is a lot further giving far lower values generally, more in line with the numbers you’re getting. It also has a noise spike before the leading edge due to long lived reflections, this is data from a long straight tunnel with metal at the end, you get some odd reflections in places like that.

And finally just a few more charts from other signals. All of these charts are from a single data set. They were all recorded on the same unit in the same location. The only difference between the plots is which other unit the received signal was coming from, simply changing the distance and direction of the signal source generated this much variation. You can see in one of them we missed the leading edge and so would have generated an incorrect range.

1 Like

I think you’re right.

I tried to read longer CIR data (30 values below the first path index and 20 values above), I think I found the peak (or step) of the real first path. It may have a time alignment error, in other words, the CIR data I read is misaligned (relative to the index I think). So I think I read 30 values below the first path index and 20 values above, but actually I read 20 (maybe) values below the first path index and 30 values above.

下载

As for the reason why the peak value is small, I think it is related to my office environment. I will test it in another environment.

Thank you. You helped me a lot.