Hi there,
I have a setup created by mdek1001 kit with 4 anchors, 7 badges, 1 gateway in a 12m x 8 m room. Localization, downlink are ok but when I subscribed to “dwm/node/+/uplink/config”, I observed that sometimes config is falsely updated and corrected immediately afterwards. You can see published jsons below. It happens in multiple tags and numbers always the same. Do you have any idea why does it happen? Thanks in advance.
{
“configuration” : {
“label” : “T3”,
“nodeType” : “TAG”,
“ble” : true,
“leds” : false,
“uwbFirmwareUpdate” : true,
“tag” : {
“stationaryDetection” : false,
“responsive” : true,
“locationEngine” : true,
“nomUpdateRate” : 100,
“statUpdateRate” : 500
}
}
}
{
“configuration” : {
“label” : “T3”,
“nodeType” : “TAG”,
“ble” : true,
“leds” : false,
“uwbFirmwareUpdate” : true,
“tag” : {
“stationaryDetection” : false,
“responsive” : true,
“locationEngine” : false,
“nomUpdateRate” : 25700,
“statUpdateRate” : 128000
}
}
}
{
“configuration” : {
“label” : “T3”,
“nodeType” : “TAG”,
“ble” : true,
“leds” : false,
“uwbFirmwareUpdate” : true,
“tag” : {
“stationaryDetection” : false,
“responsive” : true,
“locationEngine” : true,
“nomUpdateRate” : 100,
“statUpdateRate” : 500
}
}
}
Oğuz
Also locationEngine state is also toggled as can be seen in the quotations in the previous message.
Note that there is similarity between hex representations of the replaced numbers. It is as follows
100 = 0x64
25700 = 0x6464
500 = 0x01F4
128000 = 0x1F400
What do you think the reason behind the corruption of the payload? At which level the corruption is happening?
Hi Oguz,
thanks for the report! We have not seen a such issue before and really do not know why that happens.
May I ask for your assistance during the debug? I would have a couple of questions:
- When this happen, does it happen for all the Tags / Anchors or only for one/some of them? Does it always happen to the same Tag in the case of a single Tag?
- For how long does the issue happen in term of update rate? Does it fix after one update rate?
- Is it always related only to locationEngine, nomUpdateRate and statUpdateRate properties?
Thanks,
TDK
Hi @leapslabs,
Thanks for your response, my answers to your questions are as follows:
- It happens simultaneously for almost all of the tags but at different times.
- False message is published and it is corrected just after other message (After 100ms in case of 10Hz update rate)
- As far as I observed, It happens only at those fields of the json, but rarely they do not change altogether but one of them only.
Oğuz
Hi Oguz,
thanks for the feedback. This sounds like a bug but we do not know yet where. We have not observed it so far.
If possible please assist us with the debug. I would need a couple of more inputs:
- Is your Raspberry PI version 3B?
- What is the typical frequency of the issue? Seconds, minutes or hours?
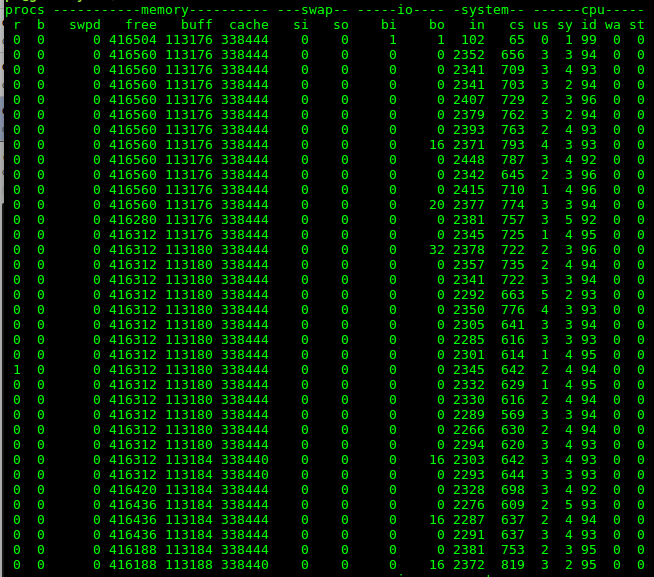
- Is there any source on your Raspberry which can generate high loads? E.g. Wifi or Ethernet driver, writing to flash, some other I/O activity? Can you please send a typical output of your linux command “vmstat 1”?
- Can you see any strange message using linux command ‘dmesg -w’ when the issue happens?
- Do you have some scripts or tools that would facilitate to detect the issue which you can share with us? We can use email if that would be an option.
Just please note that it’s likely that we will not have an update soon, but when it will come, we will try to fix the issue with your inputs.
Thanks a lot!
TDK
Hi leapsleaps,
About fix, it is not really vital but it bugging me 
If it helps, let me introduce you the scene. There are 4 Anchors, 7 Tags and 1 Gateway nodes (Complete MDEK-1001). While testing, all tags stays on table and with close proximity with each others.
1. Yes, we are using RPİ 3B.
2. Its is between seconds/minutes when all of the tags are working with 10Hz and nearby (Normally I would say 20 secs or so but today, strangely it took minutes for a single event)
3. The additional process we are running is at another computer and it subscribes to mqtt topics. So there is some load on the broker thus network. Abnormally occurs at both situation where ethernet or usb wifi adapter is used to have internet connection. Output of the
vmstat 1 is as follows.
4. There are lots of config update messages in the output of
dmesg -w. A snippet of it can be seen below
[64197.638390] dwm spi0.0: update rate in cfg=1280/257 != received=1, node x871E
[64197.638436] dwm spi0.0: update rate in cfg=1280/257 != received=1, node x871E
[64197.638457] dwm spi0.0: update rate in cfg=1280/257 != received=1, node x871E
[64296.139081] dwm spi0.0: update rate in cfg=1280/257 != received=1, node xC21D
[64296.139111] dwm spi0.0: update rate in cfg=1280/257 != received=1, node xC21D
[64296.139384] dwm spi0.0: update rate in cfg=1280/257 != received=1, node xC21D
[64383.139694] dwm spi0.0: update rate in cfg=1280/257 != received=1, node xC713
[64383.139723] dwm spi0.0: update rate in cfg=1280/257 != received=1, node xC713
[64383.139743] dwm spi0.0: update rate in cfg=1280/257 != received=1, node xC713
[64531.191919] wlan0: AP xx:xx:xx:xx:xx:xx changed bandwidth, new config is 2412 MHz, width 1 (2412/0 MHz)
[64831.229332] wlan0: AP xx:xx:xx:xx:xx:xx changed bandwidth, new config is 2412 MHz, width 2 (2422/0 MHz)
[64845.542929] dwm spi0.0: update rate in cfg=1280/257 != received=1, node xC695
[64845.542958] dwm spi0.0: update rate in cfg=1280/257 != received=1, node xC695
[64845.542980] dwm spi0.0: update rate in cfg=1280/257 != received=1, node xC695
- Additional script is subscribing to topics and sending iot messages when required. I use mqttfx to observe messages. (It happens with only using mqttfx also, I subscribe config topics by
dwm/node/+/uplink/config )
Hi Oguz,
thanks a lot for your feedback!
- OK
- OK - there must be some issue with your setup, let’s try to debug that together.
- OK - I do not see any strange thing here.
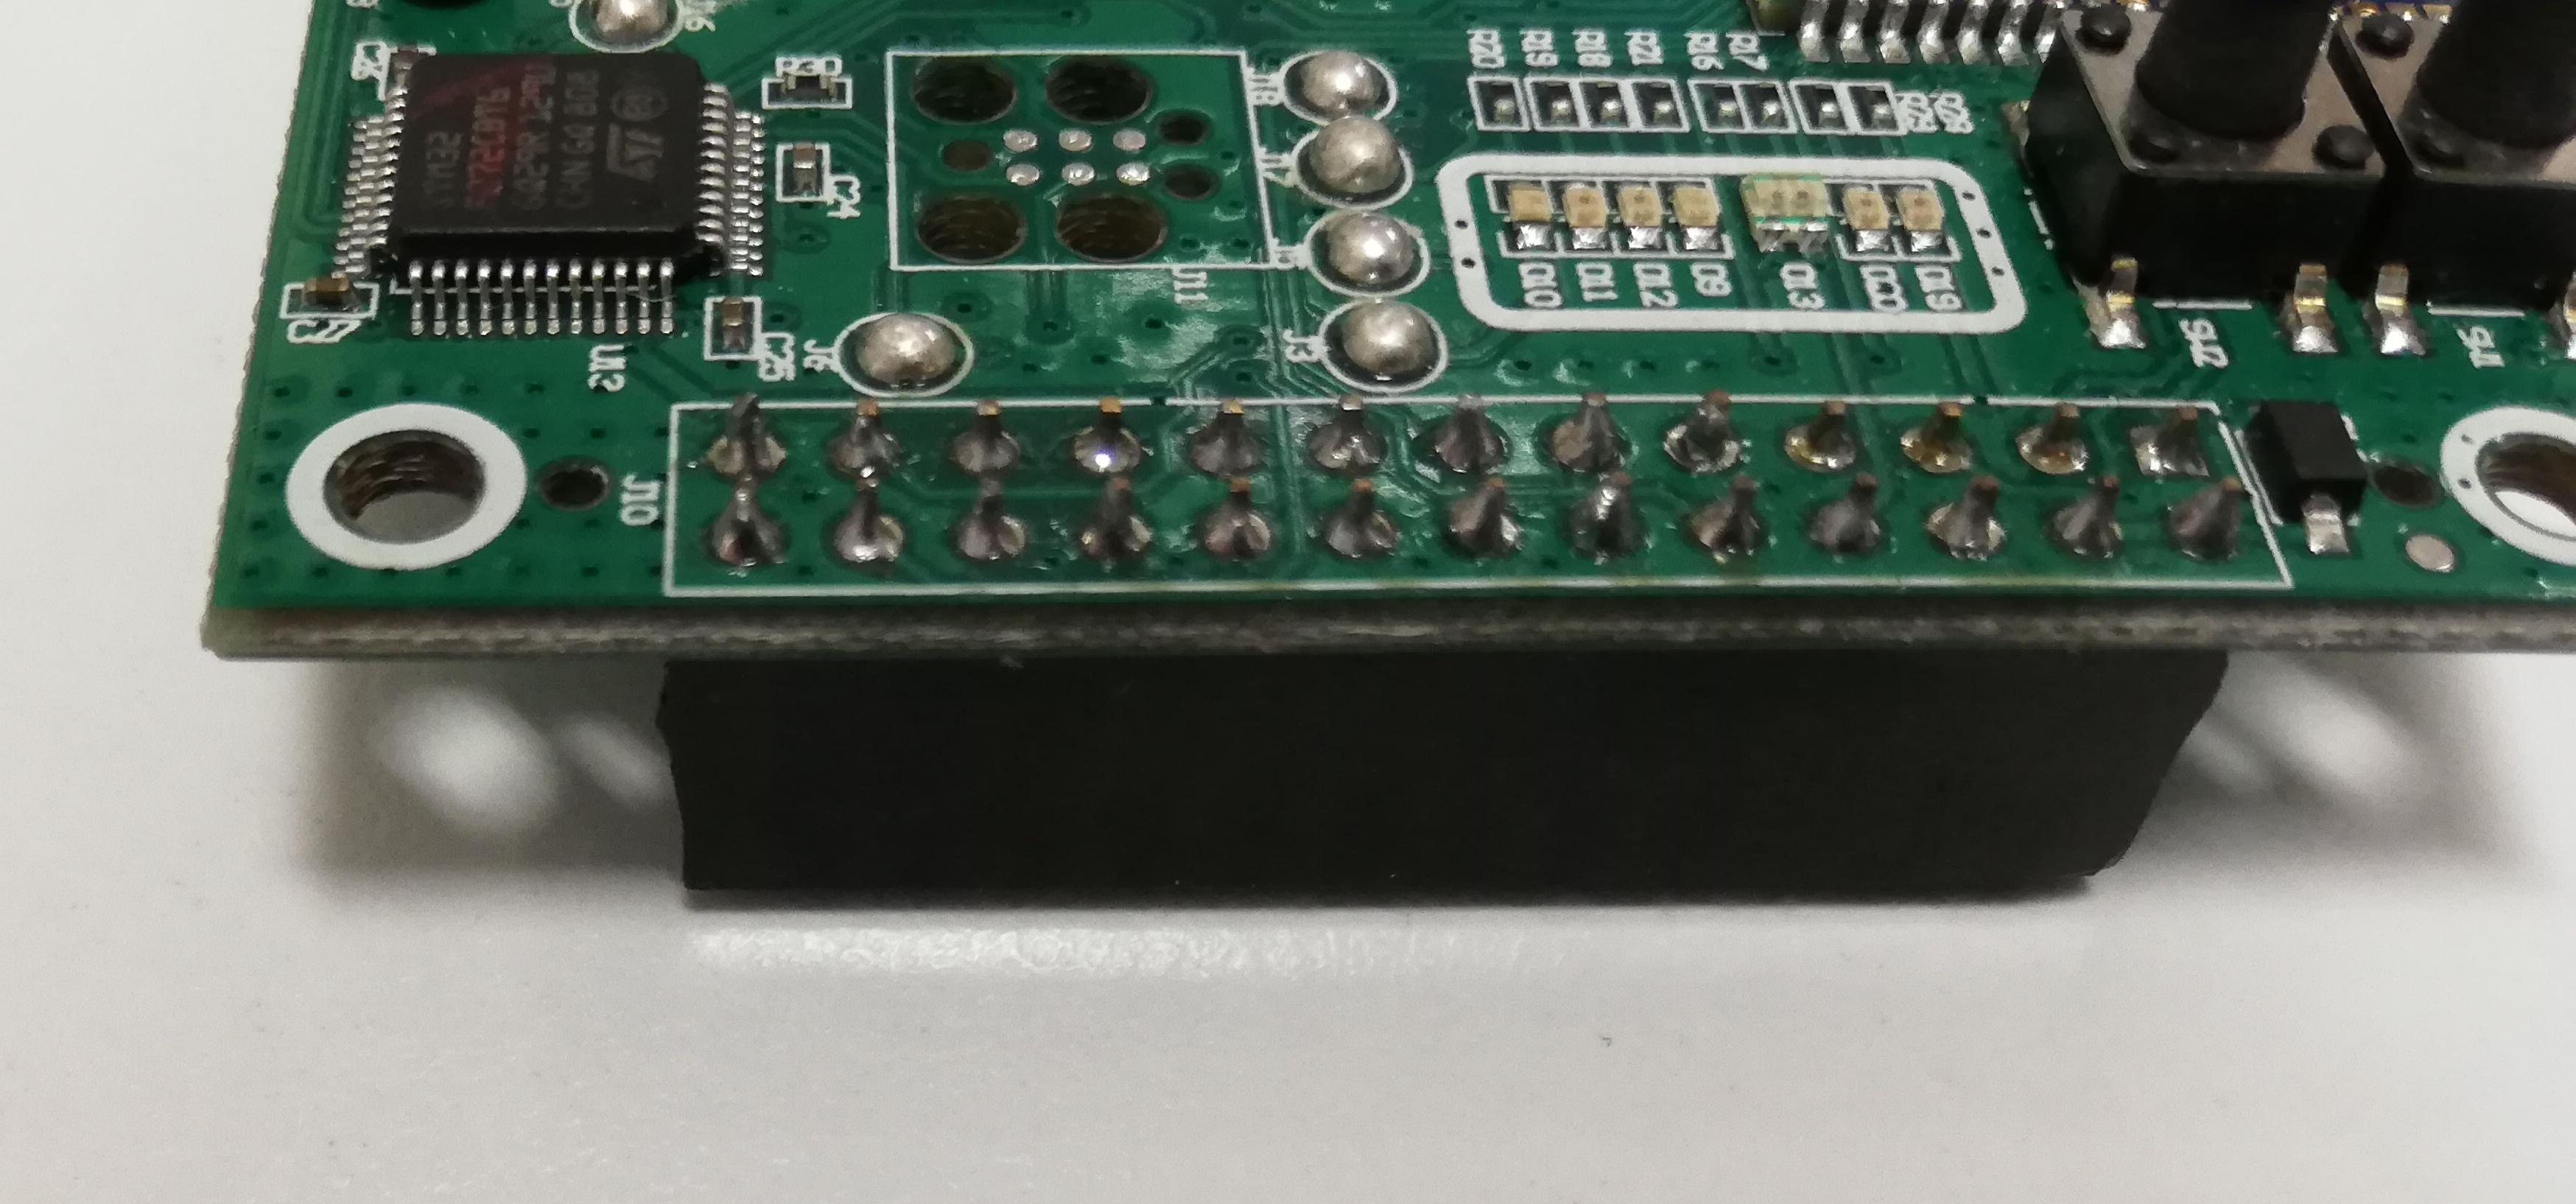
- This looks really strange. It looks like there are some errors on the SPI bus, which occurs quite often. Could you please check the soldering of the Raspberry header connector on your DWM1001-DEV board? Please send a detailed picture of it if possible. I suspect there is some HW issue or something that might influence the SPI communication with the DWM1001 module.
- OK
Cheers,
TDK
Hi leapslabs,
Here is some photos of the connections:
I think solders are ok except for two gnd pin solders which were hard due to thermal capacity. Do you think It might cause such a problem?
Thanks.
Hi Oguz,
the soldering is not perfect but I think it should be Ok. I do not know why do you experience the issue. In general it looks like to be somehow related with the SPI, i.e. communication between the DWM1001 module and the Raspberry.
Do you have any chance to try another DWM1001-DEV module as a bridge?
Cheers,
TDK
Hi,
There is some explanation or solution to the above problem.
I have the same problem (the problem appears on my both RPI gateway, I can try the third, but I assume the same result ).
For example
{
“configuration” : {
“label” : “DW58A9”,
“nodeType” : “TAG”,
“ble” : false,
“leds” : false,
“uwbFirmwareUpdate” : false,
“tag” : {
“stationaryDetection” : false,
“responsive” : true,
“locationEngine” : false,
“nomUpdateRate” : 1280300,
“statUpdateRate” : 256000
}
}
}
{
“configuration” : {
“label” : “DW58A9”,
“nodeType” : “TAG”,
“ble” : false,
“leds” : false,
“uwbFirmwareUpdate” : false,
“tag” : {
“stationaryDetection” : false,
“responsive” : false,
“locationEngine” : true,
“nomUpdateRate” : 5000,
“statUpdateRate” : 1000
}
}
}
This problem has exact behavior occurs on all tags with different probabilities (2-20x per day). Incorrect configuration data is corrected with correct data after time = update rate.
In addition to these error configuration data and their corrections, sometimes correct configuration data also comes. Is it alright ? There is a rule for this?
Regards Daniel