Cornel
March 25, 2024, 4:30pm
1
Hi,
Untitled4.qsch (2.3 KB)
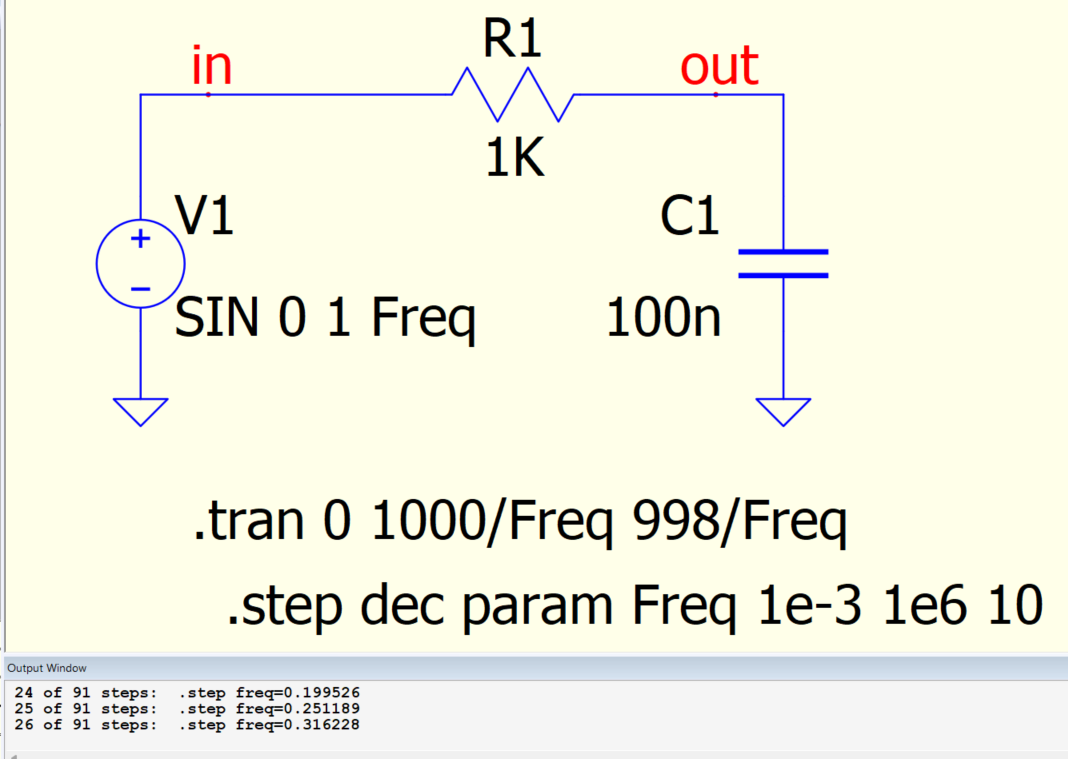
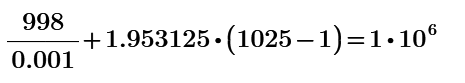
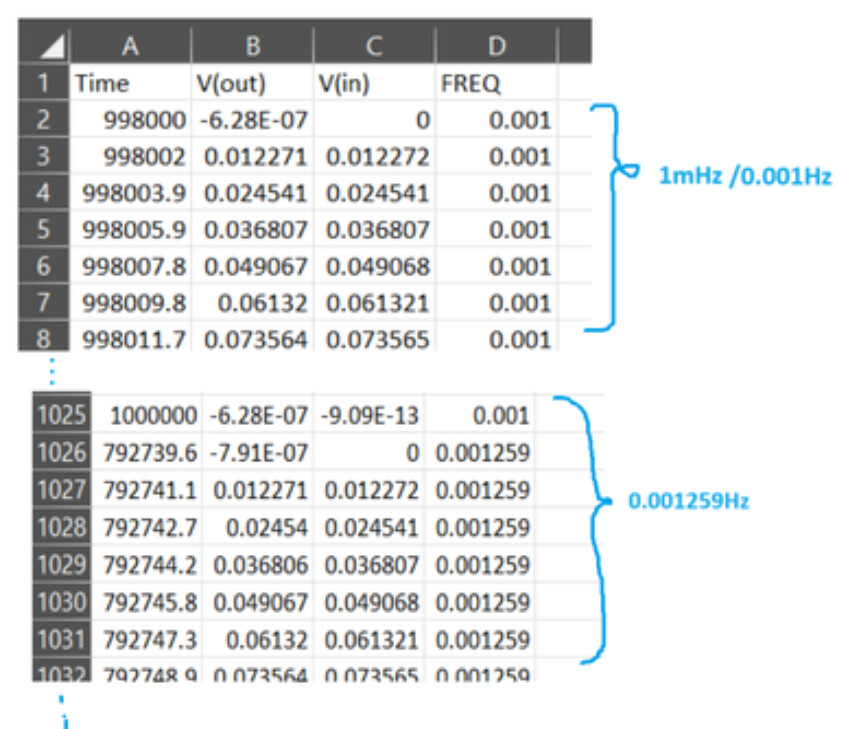
There are 1024 elements between 0.001Hz and 0.001259Hz, with a step size of 1.953125
I do not know how it is generated…
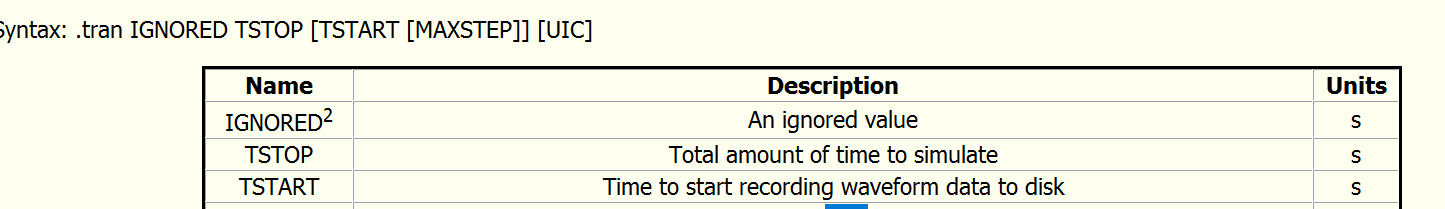
I want to know how to derived tstart, h tx, ty and tstop based on parameters from .tran: Tstop and Tstart
Cornel
March 25, 2024, 4:33pm
2
I mena I want to know how many elements are between 0.001Hz and 0.001259Hz
Cornel
March 25, 2024, 4:59pm
3
From 0.001Hz to 0.001259Hz:
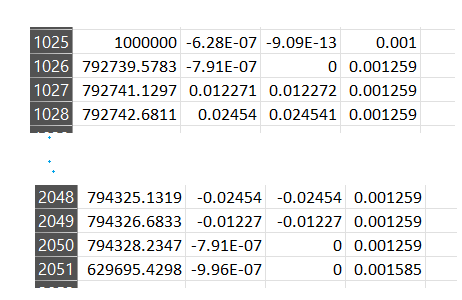
From 0.001259Hz to 0.001585Hz:
you are asking how many step is generated for .tran? for example, if the directive is .tran 0 Tstop Tstart ? And with different Tstop/Tstart, any formula to know how many step is generated?
Cornel
March 25, 2024, 5:17pm
5
Hm, I think I managed to extract what I need. For now its ok.